

Hydraulic checking reference

Engineering reference

Hydraulic basis, visible calculation chain, pipe-family matrices, source citations, and engineering limits for reviewing Water Siphon published numbers.

Use this reference to verify how screening-level flow, head, velocity, and equivalent pump-energy numbers are derived. It is a technical checking reference for engineers reviewing methodology, not a site-specific design submission.

Site-specific design still requires crest elevation and vacuum-margin review, pipe-class checks, tailwater review, transient analysis, equivalent pump benchmark review, and consenting review.

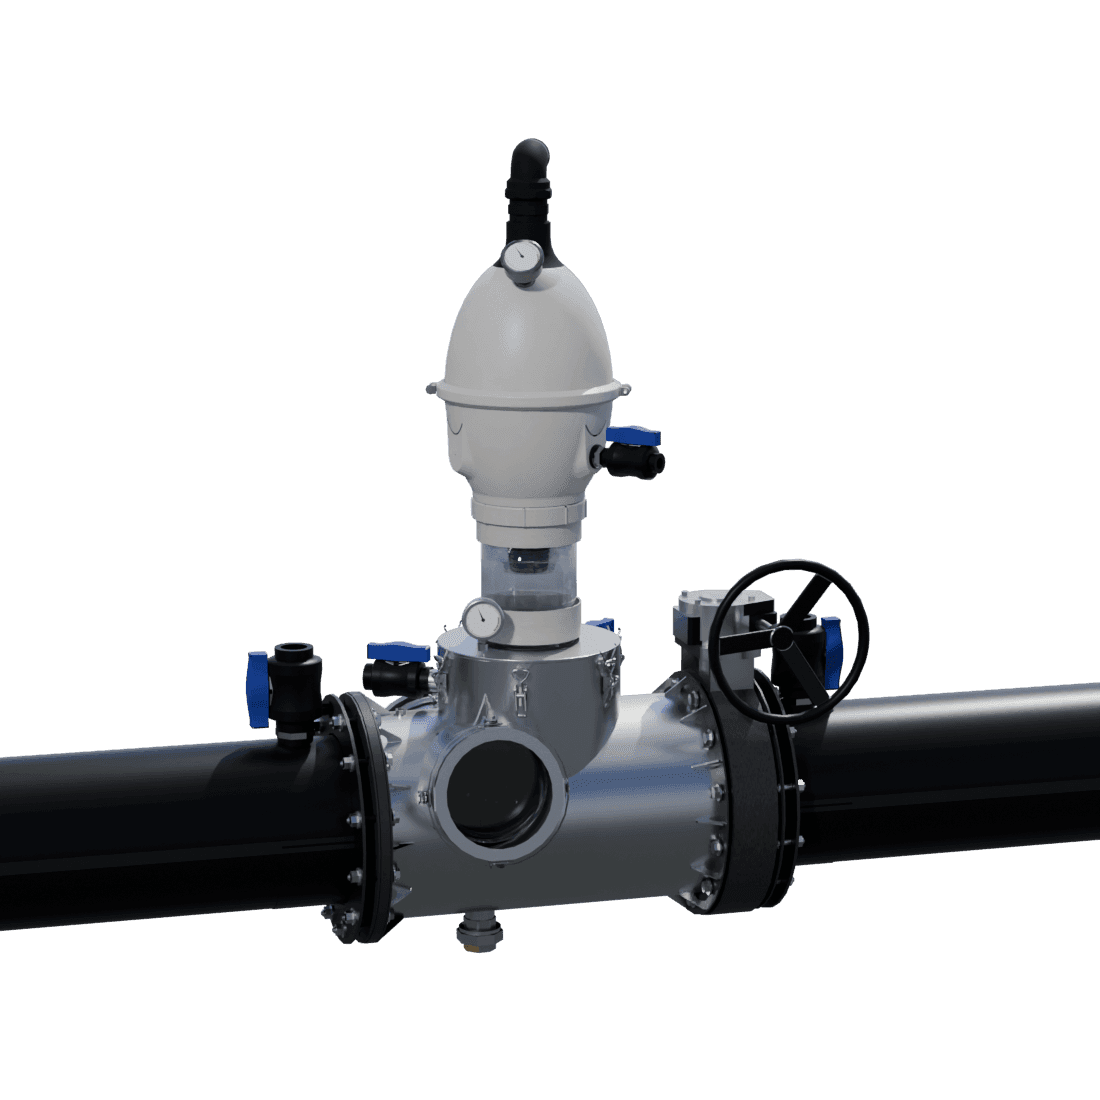
Water Siphon crest assembly showing the primer manifold, vacuum dome, gauge, and control valve.
Crest assembly and priming hardware — the physical reference point for the siphon method described below.
Pipe families
Concrete / PVC / PE

Gravity capacity and siphon capacity are separated by material and hydraulic regime.

Partial-flow states
10 / 25 / 50%

Fixed circular-pipe operating states used to interpret realistic gravity flow.

Reference head range
1-8 m ΔH

Steady-state siphon range used in the PE SDR17 screening tables.

Worked example
200 mm / 200 m / 2 m

Single verification chain tying gravity, siphon, and pump benchmark outputs together.

Lab display units
m³/min · L/s · m/s

Operating rows show primary flow, secondary flow, velocity, tanks/day, and pump-cost benchmark context.

System definition

Scope and system definition

The Water Siphon system is an actively primed, pressurised closed-pipe siphon for groundwater management and stormwater drainage. The hydraulic primer maintains vacuum at the crest so the pipe can remain full and move water up and over obstacles within the practical crest-height envelope.

The distinction that matters for the calculations is operational versus hydraulic. Operationally, meaning priming, vacuum maintenance, and crest lift, the system stays ready to run. Once running, the pipe is treated as a standard full pressure-pipe problem driven by the head differential between the intake water surface and the discharge water surface.

Every Water Siphon flow number in this reference assumes that same actively primed product running as a full pressure pipe. The comparison is screening-level: it compares natural-fall gravity drainage, Water Siphon closed-pipe flow, and an equivalent pump-energy benchmark. Site-specific design still requires the checks listed in the limits section.

Method provenance

Source basis by method

Reference numbers map each method family to its governing source basis. Full citations are listed at the end.

Open-channel gravity

Manning full-bore reference, circular partial-flow geometry, and conservative concrete roughness basis.

Chow, Open-Channel Hydraulics, 1959; NZS 4404 roughness guidance; concrete-pipe design guidance.

Plastic gravity pipe

PVC SN4 Manning roughness basis and supplier internal-diameter interpretation where published.

NZS 4404 smooth-plastic roughness guidance plus Marley and Iplex PVC product resources.

PE siphon pressure pipe

Darcy-Weisbach pressure-pipe flow, Swamee-Jain turbulent screening basis, PE roughness, and supplier mean-ID pipe dimensions. Current published cases sit inside the turbulent screening envelope.

Swamee and Jain, 1976; Iplex Poliplex PE dimensions; PE100+ Association technical guidance.

Pump-energy benchmark

TDH, shaft-power, specific-energy, and daily electricity-cost convention used only as an equivalent benchmark.

Cameron Hydraulic Data, Karassik Pump Handbook, and WSAA pressure-pipeline guidance.

Rainfall volume screen

The Comparison Lab rainfall card is a quick volume-and-drain-down screen. It is not a rainfall-runoff hydrograph, consent design, or site-specific drainage model.

Water Siphon internal screening convention, MBIE E1/VM1 Rational Method context, NRCS single-event hydrology tools, and FHWA HEC-22 drainage-design framing.

Worked example and matrix basis

Calculation chain for the stated defaults, worked example, and PE/concrete/PVC matrix extracts.

The worked example, equation sections, and pipe-family matrices in this Engineering Reference.

Field evidence

The field case is evidence from one site. It supports the operating story but is not treated as instrumented validation at scale.

Morelands Kaipara operator evidence and New Zealand pastoral drainage literature.

Method families

Three calculation families, kept separate

The reference separates the three methods before showing any matrix values. Gravity drainage is open-channel Manning flow, the Water Siphon is a closed pressure-pipe calculation, and the pump row is a matched-flow energy benchmark.

This separation is deliberate. It stops partial-flow drainage assumptions being mixed with closed-pipe siphon hydraulics, and it stops the pump comparison from being read as a pump schedule.

Gravity drainage

Manning + circular partial-flow geometry

Used for concrete and PVC drainage interpretation. The full-bore row is a reference boundary; the 25% row is the headline part-full state.

Water Siphon running flow

Darcy-Weisbach + Swamee-Jain

Used only once the line is primed and acting as a full pressure pipe. Default and published matrix cases sit inside the turbulent screening envelope.

Equivalent pump benchmark

Matched flow through the same line

Used for shaft-power, specific-energy, and NZ$/day context. It includes static lift, pipe friction, and minor losses, but remains a benchmark rather than a pump design.

Driving head

Delta H drives flow; crest lift sets the feasibility constraint

The Water Siphon can route water up and over a crest because the primer establishes and maintains the closed-pipe condition. Once the line is running, the hydraulic solver does not treat the physical high point as the available driving head.

Delta H drives flow; crest lift sets the feasibility constraint. ΔH is measured between the source water surface and the discharge water surface. Crest lift is checked separately for vacuum margin, pipe profile, and practical installation limits.

In the worked reference case, the flow solver uses 2.00 m siphon ΔH, not the crest height. That distinction is why the comparison can describe water moving over an obstacle while still using a conventional pressure-pipe head-loss equation.

Flow driver

2.00 m siphon ΔHThe worked example solves the pressure-pipe flow from the water-surface differential.

Separate feasibility check

Crest liftCrest lift controls vacuum margin and installation feasibility; it is not substituted for ΔH in the running-flow equation.

Dynamic stage screen

Tailwater and storm-stage screening

The Comparison Lab now treats receiving-water rise and storm-stage rise as one signed stage problem. The normal upstream water surface is datum 0. Storm flooding raises that source stage, while the downstream outlet starts at the normal gross drop and rises with tide, storm surge, or receiving-drain backup.

The signed net head is used for interpretation. Positive net head gives forward discharge, zero net head is a primed standing condition, and negative net head is a reverse-head condition requiring isolation or backflow-control review before relying on discharge.

Gravity flow keeps the free-outlet reference visible, but the operating screen uses the clamped hydraulic-grade slope from the current net head. The pump row estimates the shaft power needed to maintain the normal-stage target transfer during the current stage condition; it is not a pump curve or selection.

The cited manuals support the boundary-condition, tailwater, and dynamic-routing context. The exact steady-stage equations in this section are Water Siphon NZ screening abstractions, not FHWA, SWMM, or HEC-RAS design equations.

Stage equation

H_net = H_gross + H_upstream_storm - H_tailwaterSigned head from the current source stage to the current downstream receiving stage; an internal steady-stage screening convention.

Gravity screen

S_screen = max(H_net / L, 0)Internal screening hydraulic-grade slope only; outlet-control and drowned-outlet cases still need backwater analysis.

Pump stage screen

Pump TDH_current = max(H_friction,target + H_minor,target - H_net, 0)Internal energy-benchmark screen. Target losses are computed at the normal-stage transfer; positive natural head is credited before pump TDH is reported.
Current Lab default stage-impact matrix

DN225 PVC SN4 pipe (237.9 mm internal diameter), 200 m route, 2.0 m gross drop, 25% gravity basis. Pump power maintains the normal-stage Water Siphon target transfer of about 74 L/s.

ReferenceNormalTide +1.0 mTide +2.0 mStorm +1.0 m with tide +2.0 mTide +2.5 m reverse-head
Net head / state2.0 m forward1.0 m forward0.0 m stalled1.0 m forward-0.5 m reverse
Gravity screened flow / status19 L/s free-outlet reference13 L/s stage-screened; backwater check0 L/s stalled; outlet-controlled13 L/s stage-screened; backwater check0 L/s reverse-head; isolate/check
Water Siphon flow / status74 L/s running51 L/s running0 L/s primed/standing51 L/s running0 L/s reverse-head/isolation check
Pump TDH / kW to hold target transfer0.0 m / 0.00 kW1.0 m / 1.04 kW2.0 m / 2.07 kW1.0 m / 1.04 kW2.5 m / 2.59 kW

Rainfall volume screen

Rainfall drain-down is a volume screen, not a hydrologic design model

The Comparison Lab Storm Event Card answers one deliberately narrow farmer question: if this much rain falls over this much area, and this many millimetres are absorbed or held before becoming connected water, how long would the selected method take to move the remaining storm volume at the current steady flow?

The input labelled “Absorbed / held by ground” is a screening depth. It represents rainfall held in soil storage, surface depressions, pasture or interception, and the lowered pre-storm groundwater profile. It is not a measured infiltration rate, runoff coefficient, or groundwater drawdown model.

The Storm Event Card assumes the Water Siphon system has already been installed and operating before the event, so groundwater starts within the intended lowered operating range. The calculation does not simulate groundwater drawdown during the storm; it divides the selected connected storm volume by the current screened pipe-flow rate.

The public rainfall field is an event-total depth. It does not model rainfall intensity or storm duration. A 60 mm event over 2 hours and a 60 mm event over 24 hours produce the same gross rainfall volume, but not the same field flooding response. Duration, intensity, infiltration, inlet loading, catchment routing, and downstream stage over time are outside the public screening card.

Water to move depth

water_to_move_mm = max(rainfall_mm - absorbed_mm, 0)Converts the visible rainfall and absorbed-depth assumptions into the connected storm depth.

Gross rainfall volume

V_gross = rainfall_mm / 1000 × A_ha × 10,000Converts rainfall depth over hectares into cubic metres of rain falling on the catchment.

Absorbed / held volume

V_absorbed = absorbed_mm / 1000 × A_ha × 10,000Converts the absorbed-depth assumption into an equivalent volume for transparency.

Storm volume to move

V_move = water_to_move_mm / 1000 × A_ha × 10,000This is the connected storm volume divided by the selected method flow.

Theoretical pipe time

t_pipe_h = V_move / Q_m³/hUses the selected method steady flow, or pump benchmark target flow, and is independent of active flow hours.

Calendar window

t_calendar_days = V_move / (Q_m³/h × h_active × duty_factor)Active flow hours and duty factor affect daily/calendar summaries only; they do not change instantaneous hydraulic capacity.
Current Comparison Lab rainfall default

Default Storm Event Card scenario: 0 mm over 10 ha, with 0 mm absorbed or held by the ground and 0 mm remaining as connected storm depth. The UI calculates time from the exact current selected flow and does not hard-code a final time in this reference.

ReferenceValueCalculation note
Rainfall total0 mmVisible farmer input
Absorbed / held by ground0 mmScreening assumption; not a measured infiltration rate
Water to move0 mmmax(0 mm - 0 mm, 0)
Gross rainfall volume0 m³0.000 m × 10 ha × 10,000
Absorbed / held volume0 m³0.000 m × 10 ha × 10,000
Storm volume to move0 m³0.000 m × 10 ha × 10,000
Time calculationV_move / selected flowSelected method flow or pump benchmark target flow in m³/hour
Storm Event Card outlet-condition assumptions

Outlet condition separates instantaneous stage/head assumptions from daily operating-window summaries.

ReferenceActive flow assumptionStage interpretationLimitation
Non-tidal / free outlet24 h/dayOutlet remains below source stageScreening only.
Tidal outlet10 h/dayFlow shown during assumed favourable low-water stageNot a tide-table substitute.
Backed-up outlet0 h/dayTailwater set to current source stage; no forward headSite levels required.
Custom / engineer settingUser-setUser controls stage and window assumptionsProfessional judgement required.

Gravity reasoning

Partial-flow gravity is the realistic operating comparison

Gravity drains do not normally operate as pressurised full pipes. The full-bore Manning row is kept because it is a useful capacity ceiling, but the headline comparison uses part-full circular-pipe states.

The partial-flow constants are deterministic: at 10% Q/Q_full, y/D = 0.214; at the 25% headline operating state, y/D = 0.341; and at 50%, y/D = 0.500. Those values are geometry outputs, not presentation estimates.

The 25% headline operating state is used because it gives engineers a conservative part-full gravity condition while keeping the full-bore boundary visible for reference. Q/Q_full peaks near y/D = 0.938, which is why “deeper” does not scale linearly with discharge through the whole range.

Technical partial-flow pipe sequence showing 10 percent, 25 percent, 50 percent, and full-bore reference states.
Partial-flow sequenceCross-section backplate. The exact operating ratios and constants are listed below the image so the artwork stays clean.

10% state

0.214 y/DVery shallow operating point used to show the low-flow end of the circular-pipe relationship.

25% headline operating state

0.341 y/DThe headline gravity comparison row uses this part-full state rather than claiming normal full-bore operation.

50% state

0.500 y/DAt half depth, velocity equals the full-bore Manning reference in this deterministic geometry set.

Pump benchmark

Pump TDH is the full line-loss benchmark, not static lift alone

The pump row answers a narrow question: what shaft power would be required to move the matched siphon flow through the same pipe route using an electric pump benchmark?

Pump TDH distinguishes 2.00 m siphon ΔH from 4.00 m pump TDH in the worked case. The pump benchmark includes the 2.00 m static component plus 1.77 m friction and 0.23 m minor losses through the same 200 m line.

The public calculator also converts shaft power into kWh/day and NZ$/day using an editable electricity-price assumption. The current default is NZ$0.30/kWh. Changing that price changes the cost benchmark only; it does not change hydraulic flow, velocity, TDH, or shaft power.

This is why the page describes the pump result as “matched transfer · energy benchmark only.” It gives engineering context for energy and power, but it does not specify a pump, motor, duty cycle, control system, or NPSH margin.

Siphon calculation

2.00 m siphon ΔHClosed-pipe flow is solved from the available water-surface differential.

Pump TDH

4.00 m pump TDHStatic lift plus full-line losses through the same pipe route.

Loss split

1.77 m friction · 0.23 m minorRounded components from the worked benchmark chain.

Cost display

NZ$/day = kW × 24 × priceDisplayed cost uses the editable electricity price, defaulting to NZ$0.30/kWh.

Calculation basis

Governing equations

The reference is built on three equation families: Manning for gravity, Darcy-Weisbach with Swamee-Jain for the siphon, and matched-flow pump power for benchmarking. It retains pressure-pipe friction and minor losses rather than using a lossless Bernoulli shortcut.

Manning full-bore and partial-flow

Gravity capacity is tabulated from the full-bore Manning reference and then interpreted through realistic circular partial-flow states. The full-bore row is a reference boundary, not a claim that a gravity drain normally runs pressurised.

Q_full = (1 / n) × A × R^(2/3) × S^(1/2)
θ = 2 × arccos(1 − 2 × y/D)
A(y) = D² / 8 × (θ − sin θ)
P(y) = D × θ / 2
Q(y/D) = (1 / n) × A(y) × R(y)^(2/3) × S^(1/2)

Darcy-Weisbach siphon flow

The siphon is treated as a closed, fully primed pressure pipe. Total head differential drives flow; crest lift is a separate vacuum-margin and installation check, not the flow driver itself. The current solver preserves the Swamee-Jain screening output and reports whether custom inputs remain inside the turbulent screening envelope.

ΔH = (f × L / D + ΣK) × v² / (2g)
f = 0.25 / (log10(k_s / (3.7 × D) + 5.74 / Re^0.9))²
Re = v × D / ν
Q = A × v

Equivalent pump benchmark

The pump comparison is a matched-flow shaft-power benchmark only. The public NZ$/day value is a cost conversion from shaft power and an editable tariff assumption; it gives energy context without becoming a pump schedule, duty validation, or NPSH review.

TDH = H_static + H_friction + H_minor
P_shaft = ρ × g × Q × TDH / η
E_kWh_per_ML = ρ × g × TDH × 1000 / (η × 3.6 × 10⁶)
C_day = P_shaft,kW × 24 × price_NZ$/kWh

Reference settings

Defaults and assumptions

These are the screening values used throughout the reference. Each value is paired with its interpretation and provenance so changes can be reviewed before any numerical output is revised.

Reference itemValueInterpretationSource basis
Concrete Manning n0.012Clean machine-made concrete reference used as a conservative gravity baseline.NZS 4404 roughness guidance and Chow open-channel reference.
PVC / PE smooth-plastic Manning n0.009Smooth-bore gravity reference for PVC SN4 and PE pipe in gravity/open-channel mode.NZS 4404 smooth-plastic range plus Marley, Iplex PVC, and Iplex PE product resources.
Plastic pressure-pipe roughness k_s0.003 mmClean new plastic pressure-pipe roughness used in the Darcy-Weisbach solver for PVC/PE pressure comparisons.Iplex PE hydraulic design guidance and PE100+ technical guidance.
Pressure-pipe friction regimeSwamee-Jain turbulent screeningDefault and published matrix cases are inside the screening envelope. Current PE matrix rows stay above Re 48,000, and the verifier checks Swamee-Jain against an implicit Colebrook-White solve with worst flow delta below 0.4%.EPANET 2.2 Darcy-Weisbach regime framing, Colebrook-White verifier sweep, and Water Siphon production guardrail metadata.
Minor-loss sum ΣK2.0Screening allowance for intake, bends, valves, and outlet losses. It is not a validated Water Siphon system constant.Standard pumping-hydraulics convention; sensitivity range held for design review.
Pump efficiency η0.70Benchmark shaft efficiency only; motor, drive, transformer, and tariff effects are outside scope.Preliminary pump-benchmark convention from standard pump references.
Electricity priceNZ$0.30/kWhEditable public calculator assumption used to convert pump benchmark shaft power into NZ$/day.Water Siphon Comparison Lab display convention.
Tank equivalent volume25,000 LDisplay-only benchmark for tanks/day and storm-volume equivalents. It does not change hydraulic capacity.Water Siphon Comparison Lab display convention.
Reference run length200 mStandard PE siphon comparison length used for the matrix and worked example.Screening convention reproduced in the worked example and pipe-family matrices in this reference.

Terms

Terms used in the tables

The matrices use pipe catalogue language and hydraulic shorthand. These definitions are included here so the tables do not assume prior familiarity.

OD
Outside diameterCatalogue PE pipe sizes are usually named by outside diameter. Hydraulic flow is calculated from internal diameter, not OD.
ID
Internal diameterThe diameter used in the flow equations. The catalogue tables use supplier mean IDs where available; DN and OD are not silently treated as ID.
SDR17
Standard dimension ratio 17PE pipe wall-thickness class where outside diameter divided by wall thickness is 17.
PE100
Pressure-pipe material classPolyethylene pressure-pipe grade used for the closed, fully primed siphon pressure-pipe tables.
DN
Nominal diameterCatalogue sizing language used for concrete and PVC gravity pipes. DN is a family label, not always the measured internal bore.
ΔH
Water-surface head differentialElevation difference between source and discharge water surfaces. It is not the crest height.
ΣK
Minor-loss allowanceA screening sum for fittings, valves, bends, intake, and outlet losses.
TDH
Total dynamic headPump benchmark head made up of static lift, pipe friction, and minor losses.

Calculation chain

Worked example — 200 mm reference case

Reference inputs: 200 mm internal diameter, 200 m pipe run, 2.00 m total head differential, PE k_s = 0.003 mm, ν = 1.3e-6 m²/s, ΣK = 2.0, and pump benchmark η = 0.70. Self-priming describes the Water Siphon operating mechanism; it is not a separate calculation version. The worked Water Siphon value is the 47.39 L/s result for this reference case.

  1. Input set

    200 mm / 200 m / 2.00 m ΔH

    The same reference inputs are carried through gravity reference flow, partial-flow interpretation, Water Siphon pressure-pipe flow, and equivalent pump-energy benchmarking.

  2. Gravity full-bore reference

    35.53 L/s

    At S = 0.010 and n = 0.012, A = 0.03142 m² and R = 0.050 m. Manning gives v_full = 1.131 m/s and Q_full = 35.53 L/s.

  3. Gravity at 25% partial-flow state

    8.88 L/s

    The deterministic α = 0.25 circular-pipe state resolves to y/D = 0.341 and v/v_full = 0.831. Discharge is 25% of the full-bore reference: 8.88 L/s.

  4. Water Siphon pressure-pipe flow

    47.39 L/s

    With PE k_s = 0.003 mm, ν = 1.3e-6 m²/s, L = 200 m, D = 0.200 m, ΔH = 2 m, and ΣK = 2.0, Swamee-Jain friction converges at f = 0.01524, v = 1.509 m/s, and Re = 2.32e5, inside the screening envelope.

  5. Equivalent pump benchmark

    2.66 kW / 15.57 kWh·ML⁻¹

    Matching the siphon duty through the same main gives H_friction = 1.767 m, H_minor = 0.232 m, TDH = 4.00 m, 2.66 kW shaft power, and 15.57 kWh per megalitre at η = 0.70.

Sensitivity

Sensitivity

This table is a calculation audit for the OD225 / 3 m PE matrix scenario. It is not a second Water Siphon product version. The key lesson is that actual internal diameter affects siphon flow far more than smooth-plastic roughness within the defensible research band.

Internal diameter and roughness audit

OD225 PE100 SDR17 scenario, 200 m line, 3 m head differential, base k_s = 0.003 mm, ΣK = 2.

ReferenceFlow (L/s)Interpretation
Base case, k_s = 0.003 mm, ID 197.8, ΣK = 257.4Reference OD225 / 3 m scenario using the supplier mean ID.
Lower smooth-plastic roughness, k_s = 0.0015 mm57.6Very small change from the base scenario.
Upper research roughness, k_s = 0.007 mm57.0Very small change from the base scenario.
Upper NZ service roughness, k_s = 0.015 mm56.3Still a modest roughness effect.
Nominal OD used incorrectly as ID, 225 mm79.9Large error because OD is not the hydraulic diameter.
No minor-loss allowance, ΣK = 061.5Shows why fitting losses are retained in screening.

Use and interpretation

How to read the matrices

  • Treat full-bore gravity capacity as a reference ceiling. Real gravity drainage should be checked at realistic part-full operating states and freeboard conditions.
  • Use concrete tables only for gravity interpretation. PVC SN4 and PE SDR17 rows separate catalogue size from hydraulic bore; Water Siphon and pump benchmarks use valid smooth-plastic pressure-pipe selections, with project-specific pipe class and vacuum suitability still requiring engineering review.
  • Read ΔH as the total head differential between upstream and downstream water surfaces; do not substitute crest lift for ΔH in the siphon calculation.
  • Use the pump benchmark for energy and power context only. It is not a pump schedule, duty validation, procurement recommendation, or NPSH review.
  • Use these matrices only within the stated assumptions. Project-specific pipe class, roughness, route length, fittings, and head conditions require project-specific recalculation.

Capacity matrices

Pipe family matrices

These tables expose the pipe families, operating states, and benchmark values used by the screening numbers. Each caption states the equation family, defaults, and pipe-property basis so a reviewer can spot-check cells independently. DN and OD entries are catalogue labels; hydraulic calculations use the internal diameter shown beside the row where supplier IDs are available.

Matrix 1 - current New Zealand size availability

Catalogue families used by the calculator. PVC and PE rows use supplier mean internal diameters where published; concrete remains a gravity/open-channel nominal-DN reference.

ReferenceSupplier referenceCatalogue size rangeUse in this reference
PVC SN4 stormwater pipeMarley Stormline / Iplex NovadrainDN90-DN375Default farmer-facing band to DN300; DN375 gravity-only reference.
Concrete roller compacted pipeHumes RCPDN225-DN600Small and medium gravity stormwater, culvert, and drainage.
Concrete radial press pipeHumes TITAN RPDN675-DN1050Large-diameter stormwater and culvert range.
Large-diameter concrete pipeHynds PinnacleDN675-DN3000Large-diameter concrete option in NZ market.
PE100 SDR17 / PN10 pressure pipeIplex PoliplexOD110-OD1800 in the selectorPressure-pipe family suitable as leakproof siphon pipe basis; OD-labelled, supplier-ID calculated.
PE pressure / drainage pipe range cross-checkHynds PEDN16-DN2000Broad NZ PE range cross-check; fake PE375 and PE1500 selector rows are not used.

Partial-flow operating constants

Deterministic circular-pipe ratios used across the gravity interpretation work.

Referenceα = Q/Q_fully/Dv/v_full
10% operating state0.100.2140.639
25% operating state0.250.3410.831
50% operating state0.500.5001.000

Concrete gravity full-bore capacity (L/s)

Full-bore Manning reference at n = 0.012. This is a capacity ceiling, not a normal operating depth.

Reference0.50%0.75%1.00%1.50%2.00%
DN22534.442.148.659.668.8
DN30074.190.7104.8128.3148.2
DN375134.3164.5189.9232.6268.6
DN450218.4267.5308.9378.3436.8
DN525329.4403.5465.9570.6658.9
DN600470.4576.1665.2814.7940.7
DN675643.9788.6910.611151288
DN750852.81044120614771706
DN90013871698196124022774
DN105020922562295836234184

Concrete gravity 25% operating state (L/s)

Inverse-solved circular partial-flow state at y/D = 0.341 and v/v_full = 0.831.

Reference0.50%0.75%1.00%1.50%2.00%
DN2258.610.512.214.917.2
DN30018.522.726.232.137.0
DN37533.641.147.558.267.2
DN45054.666.977.294.6109.2
DN52582.4100.9116.5142.7164.7
DN600117.6144.0166.3203.7235.2
DN675161.0197.2227.7278.8322.0
DN750213.2261.1301.5369.3426.4
DN900346.7424.6490.3600.5693.4
DN1050523.0640.5739.6905.81046

PVC SN4 gravity full-bore capacity (L/s)

Full-bore Manning reference at n = 0.009 for smooth plastic gravity pipe. Rows use supplier mean ID where published.

Reference0.50%0.75%1.00%1.50%2.00%
DN90 (ID 90.0)4.04.95.66.98.0
DN100 (ID 100.0)5.36.57.59.110.6
DN150 (ID 152.1)16.119.822.828.032.3
DN175 (ID 190.4)29.436.041.650.958.8
DN225 (ID 237.9)53.265.275.392.2106.4
DN300 (ID 299.7)98.5120.6139.3170.6197.0
DN375 (ID 380.7)186.4228.3263.7322.9372.9

PVC SN4 gravity 25% operating state (L/s)

Inverse-solved circular partial-flow state at y/D = 0.341 and v/v_full = 0.831. Rows use supplier mean ID where published.

Reference0.50%0.75%1.00%1.50%2.00%
DN90 (ID 90.0)1.01.21.41.72.0
DN100 (ID 100.0)1.31.61.92.32.6
DN150 (ID 152.1)4.04.95.77.08.1
DN175 (ID 190.4)7.39.010.412.714.7
DN225 (ID 237.9)13.316.318.823.026.6
DN300 (ID 299.7)24.630.234.842.749.3
DN375 (ID 380.7)46.657.165.980.793.2

Matrix 3 - running siphon, PE SDR17 siphon discharge over 200 m (L/s)

Darcy-Weisbach with Swamee-Jain friction factor, plastic k_s = 0.003 mm, and ΣK = 2. Rows use Iplex Poliplex SDR17 / PN10 mean IDs; no PE375 or PE1500 row is inserted.

Reference1 m2 m3 m4 m5 m6 m7 m8 m
OD110 (ID 96.5)4.87.18.810.411.713.014.115.2
OD125 (ID 109.9)6.810.012.514.616.518.219.821.4
OD140 (ID 123.1)9.113.416.819.622.224.526.728.7
OD160 (ID 140.7)13.019.023.827.831.434.737.840.6
OD180 (ID 158.3)17.725.932.337.842.747.151.255.1
OD200 (ID 175.8)23.234.042.449.655.961.867.172.2
OD225 (ID 197.8)31.646.157.467.175.783.690.897.6
OD250 (ID 220.0)41.560.575.488.199.4109.7119.1128.0
OD280 (ID 246.3)55.580.8100.6117.5132.4146.1158.7170.4
OD315 (ID 277.1)74.9109.0135.6158.3178.4196.7213.6229.4
OD355 (ID 311.1)100.5146.0181.5211.7238.5262.9285.4306.5
OD400 (ID 351.9)137.1198.8247.0287.9324.3357.3387.8416.3
OD450 (ID 395.9)184.0266.5330.8385.5434.0478.0518.7556.7
OD500 (ID 440.0)239.1345.9429.1499.8562.4619.3671.8720.9
OD560 (ID 492.7)315.8456.4565.7658.6740.8815.5884.5948.8
OD630 (ID 554.4)421.2607.9752.9876.0985.1108411751261
OD710 (ID 624.6)562.0809.9100211661310144115631675
OD800 (ID 703.9)748.21077133215481739191320732222
OD900 (ID 791.7)988.91421175720412292252027302926
OD1000 (ID 879.7)12671819224626092929322034873737
OD1200 (ID 1062.3)19622812346940264518496453755758
OD1400 (ID 1231.8)27543940485756336319694175138047
OD1600 (ID 1407.2)3721531865517594851693511012010837
OD1800 (ID 1585.6)486069398544990011099121841318314115

Equivalent pump shaft power to match siphon flow (kW)

Shaft power to move the matched siphon flow through the same 200 m PE main at the stated static lift, including friction and minor losses. Not a pump selection.

Reference3 m lift5 m lift8 m lift
OD225 at 57.4 L/s4.836.448.85
OD315 at 135.6 L/s11.4015.2020.90
OD355 at 181.5 L/s15.2620.3527.98
OD450 at 330.8 L/s27.8237.0951.00
OD1000 at 2246 L/s189252346
OD1800 at 8544 L/s7189581317

Equivalent pump specific energy (kWh/ML)

Head-only energy values at η = 0.70, excluding tariff and detailed pump-selection effects.

Reference1 m2 m3 m4 m5 m6 m7 m8 m
kWh/ML3.897.7911.6815.5719.4623.3627.2531.14

Minimum concrete DN for target flow

Capacity-ceiling quick-sizing matrix at full-bore Manning n = 0.012.

Reference0.50%0.75%1.00%1.50%2.00%
25 L/sDN225DN225DN225DN225DN225
50 L/sDN300DN300DN300DN225DN225
75 L/sDN375DN300DN300DN300DN300
100 L/sDN375DN375DN300DN300DN300
150 L/sDN450DN375DN375DN375DN375
200 L/sDN450DN450DN450DN375DN375
300 L/sDN525DN525DN450DN450DN450
400 L/sDN600DN525DN525DN525DN450
500 L/sDN675DN600DN600DN525DN525
700 L/sDN750DN675DN675DN600DN600
900 L/sDN900DN750DN675DN675DN600

Minimum PE SDR17 OD for target flow

Minimum catalogue OD by siphon head differential over the 200 m reference run.

Reference1 m2 m3 m4 m5 m6 m7 m8 m
25 L/sOD225OD180OD180OD160OD160OD160OD140OD140
50 L/sOD280OD250OD225OD225OD200OD200OD180OD180
75 L/sOD355OD280OD250OD250OD225OD225OD225OD225
100 L/sOD355OD315OD280OD280OD280OD250OD250OD250
150 L/sOD450OD400OD355OD315OD315OD315OD280OD280
200 L/sOD500OD450OD400OD355OD355OD355OD315OD315
300 L/sOD560OD500OD450OD450OD400OD400OD400OD355
400 L/sOD630OD560OD500OD500OD450OD450OD450OD400
500 L/sOD710OD630OD560OD560OD500OD500OD450OD450
700 L/sOD800OD710OD630OD630OD560OD560OD560OD500
900 L/sOD900OD800OD710OD710OD630OD630OD630OD560

Verification

Validation and reproducibility

The numbers are reproducible from the equation chain, defaults, and tabulated values in this reference. The Comparison Lab uses the same equation families and defaults for input-specific checks.

  • Manning gravity, circular partial-flow ratios, Darcy-Weisbach siphon flow, and equivalent pump energy are kept as separate equation families.
  • The worked example and pipe-family matrices are verified against the same hydraulic routines used by the Comparison Lab.
  • The hydraulic verifier prints a deterministic Comparison Lab length sweep with length, head, flow, velocity, Reynolds screening status, friction basis, daily volume, and storm pipe-hours.
  • The public operating rows display m³/min as the primary flow unit, with L/s and m/s retained as engineering secondary values. Tank equivalents and NZ$/day are display conversions only.
  • The hydraulic verifier checks the public PE matrix against an implicit Colebrook-White turbulent reference; current rows stay above Re 48,000 with worst flow delta below 0.4%.
  • The Comparison Lab and Engineering Reference share the same equation basis, so custom inputs and reference defaults stay comparable.
  • Any project that changes pipe class, roughness, route length, fittings, head differential, or pump efficiency requires recalculation before the numbers are used for design decisions.

Field evidence

Field evidence — Morelands Kaipara

Morelands is a dairy operation on Kaipara marine clay. The field case is useful because it reports both water-level response and farm-production outcomes, but it remains one site, one operator, and one installation year.

These figures should not be generalised to every site. They support the claim that lowering the resting groundwater table can materially change land performance where the same site constraints are present.

Morelands reported outcomes

Evidence-grade language is intentionally explicit: the case is field evidence, not instrumented validation at scale.

ReferenceReported outcomeEvidence grade
Resting groundwater table reduction225 mmCase-study field outcome
Open drain level reduction400 mmCase-study field outcome
Response window4 daysCase-study field outcome
Shoulder-season pasture loss attributed to waterlogging before installation~30% from May-SeptemberGrower-reported video interview, 2025
Pasture harvest increase+4 tonnes dry matter per hectareOn-farm measured, operator
Milksolids production increase+300 kilograms per hectareOn-farm measured, operator
First-year return on capital76%On-farm measured, operator

Out-of-scope checks

Limits and exclusions

This reference supports screening-level hydraulic checking only. The following items remain outside the scope of the document and still require project-specific engineering review.

  • Crest vacuum margin, including atmospheric pressure, water temperature, vapour pressure, and pipe-profile elevation.
  • Pipe-class vacuum resistance and buckling under external load for the selected pressure class or SDR.
  • Pressure-pipe cases outside the turbulent screening envelope. The current public output preserves Swamee-Jain screening values; outside-envelope custom inputs require engineer review before design use.
  • Pump curve matching, NPSH review, motor efficiency, drive efficiency, duty cycle, and system-curve intersection.
  • Primer-cycle capacity for site air ingress, restart conditions after dry periods, partial blockage, and operational reliability at commercial scale.
  • Design-grade rainfall-runoff hydrographs, time-of-concentration analysis, backwater profiles, downstream boundary-stage time series, and pump selection for tidal receivers and constrained outfalls.
  • Sediment handling, fouling, long-term roughness ageing, transient effects, water hammer, and surge.
  • Structural design of the primer manifold and all regulatory, consenting, discharge-quality, and land-access requirements.

Refs

References

  1. [1]Chow, V.T. (1959). Open-Channel Hydraulics.
  2. [2]NZS 4404 roughness coefficient preview.
  3. [3]Concrete Pipe Association of Australasia hydraulic design guidance.
  4. [4]Iplex Novadrain DWV pipe and fittings product information guide, SN4 mean internal diameter rows.
  5. [5]Marley Stormline SN4 stormwater product range.
  6. [6]Swamee, P.K., and Jain, A.K. (1976). Explicit equations for pipe-flow problems.
  7. [7]Iplex Poliplex polyethylene pressure pipe producer statement, SDR17 / PN10 mean ID rows.
  8. [8]PE100+ Association technical guidance.
  9. [9]Vinidex pressure-pipe vacuum and buckling guidance.
  10. [10]Cameron Hydraulic Data.
  11. [11]Karassik Pump Handbook.
  12. [12]WSA 03-2011 Water Supply Code.
  13. [13]Water Siphon calculation basis and matrix review record.
  14. [14]Water Siphon Ltd. Morelands Kaipara customer reference video, 2025.
  15. [15]DairyNZ managing pugging damage and winter pasture management extension material.
  16. [16]Thorrold, B.S., et al. (2014). Evaluating the benefits of standing cows off pasture to avoid soil pugging damage in New Zealand.
  17. [17]Drewry, J.J., et al. (2013). Controlled drainage systems for New Zealand pastoral systems.
  18. [18]United States Environmental Protection Agency, EPANET documentation, EPANET 2.2 Analysis Algorithms covering Darcy-Weisbach friction regimes, Reynolds-number thresholds, minor losses, pumps, and pumping energy.
  19. [19]Humes NZ RCP and TITAN RP catalogue ranges.
  20. [20]Hynds NZ concrete and PE catalogue ranges.
  21. [21]Federal Highway Administration, Hydraulic Design Series No. 5: Hydraulic Design of Highway Culverts, outlet control and tailwater design framing.
  22. [22]United States Environmental Protection Agency, Storm Water Management Model Reference Manual Volume II — Hydraulics, dynamic runoff and hydraulic routing reference.
  23. [23]U.S. Army Corps of Engineers HEC-RAS Hydraulic Reference Manual, downstream stage-hydrograph boundary conditions for tidal or backwater environments.
  24. [24]MBIE. Acceptable Solutions and Verification Methods for New Zealand Building Code Clause E1 Surface Water, E1/VM1 Rational Method and runoff-coefficient context.
  25. [25]USDA NRCS Hydrology and Hydraulics tools, including WinTR-55 and WinTR-20 single-event watershed hydrology models.
  26. [26]Federal Highway Administration, Urban Drainage Design Manual Fourth Edition, Hydraulic Engineering Circular No. 22 (HEC-22), storm drainage and pump-station design framing.
  27. [27]NASA Glenn Research Center, Bernoulli equation assumptions and restrictions for steady, inviscid, incompressible flow framing.